Plotting with oplot
[21]:
import ograph.ofig as of
import ograph.oplot as op
import matplotlib.pyplot as plt
import numpy as np
Create an Axes3D
[22]:
of.fig3()
op.annotate("Title", "x", "y", "z")

plt.show()
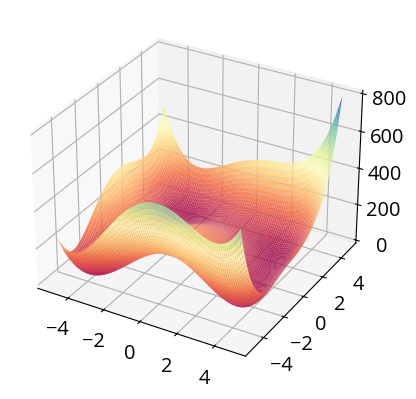
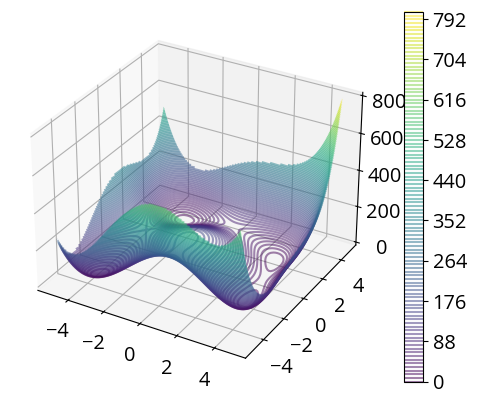
Contour plots Use plot_wireframe for wireframe plots, and plot_surface for surface plots.
[23]:
def himmelblau(x, y):
    return (x ** 2 + y - 11) ** 2 + (x + y ** 2 - 7) ** 2
of.fig3()
op.surface(himmelblau, (-5,5), (-5,5), alpha=0.5)
plt.show()
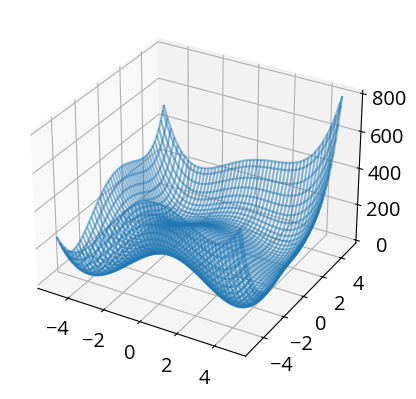
[24]:
def himmelblau(x, y):
    return (x ** 2 + y - 11) ** 2 + (x + y ** 2 - 7) ** 2
of.fig3()
op.wireframe(himmelblau, (-5,5), (-5,5), alpha=0.5)
plt.show()
[25]:
of.fig3()
op.contour(himmelblau, (-5,5), (-5,5), levels=100, alpha=0.5)
plt.show()
[26]:
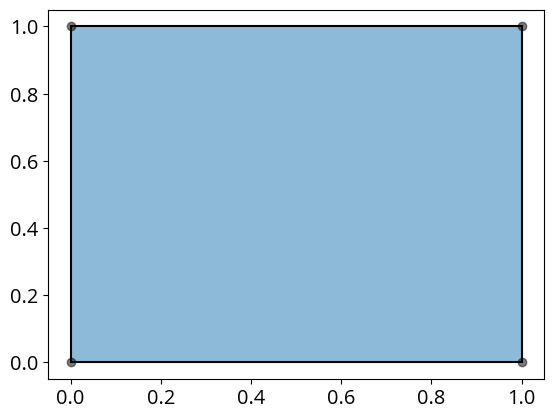
from scipy.spatial import ConvexHull, distance #type: ignore
fig = plt.figure()
ax = plt.axes()
op.chull(op.unit_square)
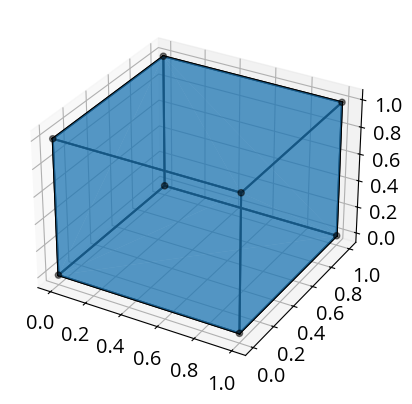
[27]:
fig = plt.figure()
ax = plt.axes(projection="3d")
op.chull(op.unit_cube)
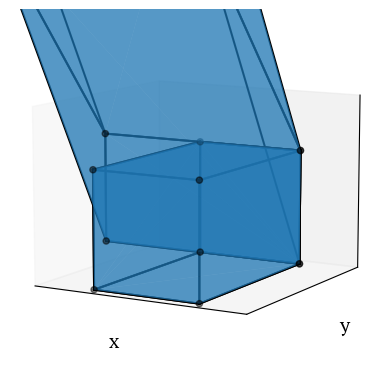
[28]:
transform = np.array([
    [2,0,0],
    [0,1,0],
    [0,3,1]
])

source = op.unit_cube.T

new_unit = transform.dot(source).T
# np.matmul(transform, source)
fig = plt.figure()
ax = plt.axes(projection="3d")
ax.view_init(10, 120)
ax.set_zlabel("z", fontname = 'PT Serif')
op.annotate("", "x", "y", "z")
ax.set_xticks([])
ax.set_yticks([])
ax.set_zticks([])
ax.set_xlim3d(-0.5, 1.5)
ax.set_zlim3d(0, 1.5)
for side in ['top','right','bottom','left']:
    ax.spines[side].set_visible(False)
ax.tick_params(axis='both',which='both',labelbottom=False,bottom=False,left=False)


op.chull(op.unit_cube)
op.chull(new_unit)
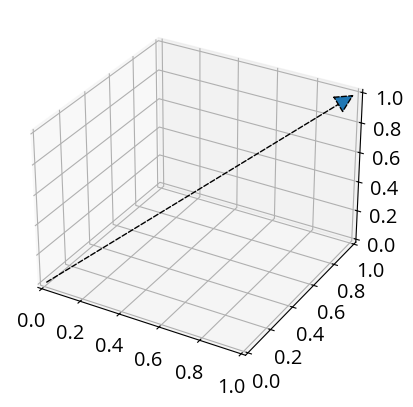
Plot an arrow with oplot.arrow.
[29]:
of.fig3()
op.arrow((0,0,0),
         (1,1,1))
plt.show()
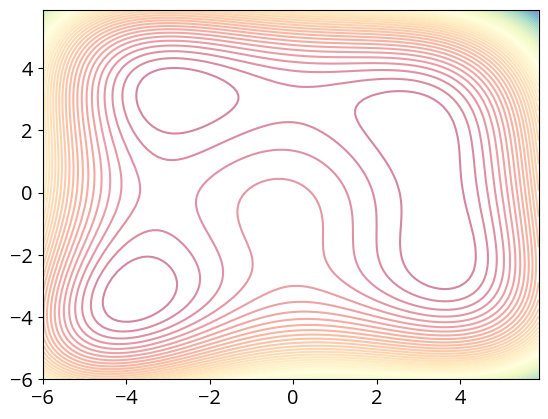
[30]:
from ograph.ofunc import himmelblau

of.fig2()
op.contour(himmelblau, (-6, 6), (-6, 6), cmap="Spectral", colorbar=False)
plt.show()
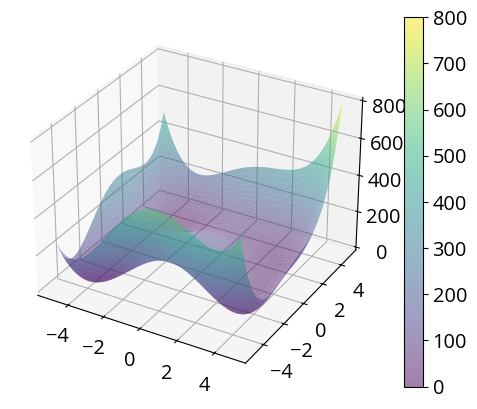
[31]:
of.fig3()
op.surface(himmelblau, (-5, 5), (-5, 5), cmap="Spectral", colorbar=False)
plt.show()