[1]:
import automuse
import automuse.chord as chord
import automuse.modes as modes

import matplotlib.pyplot as plt
plt.rcParams['figure.dpi'] = 300
[2]:
from automuse.midi import voice
Visualising Notes
AutoMuse comes with utilities that visualise notes on a fretboard. These can be found in automuse.guitar.
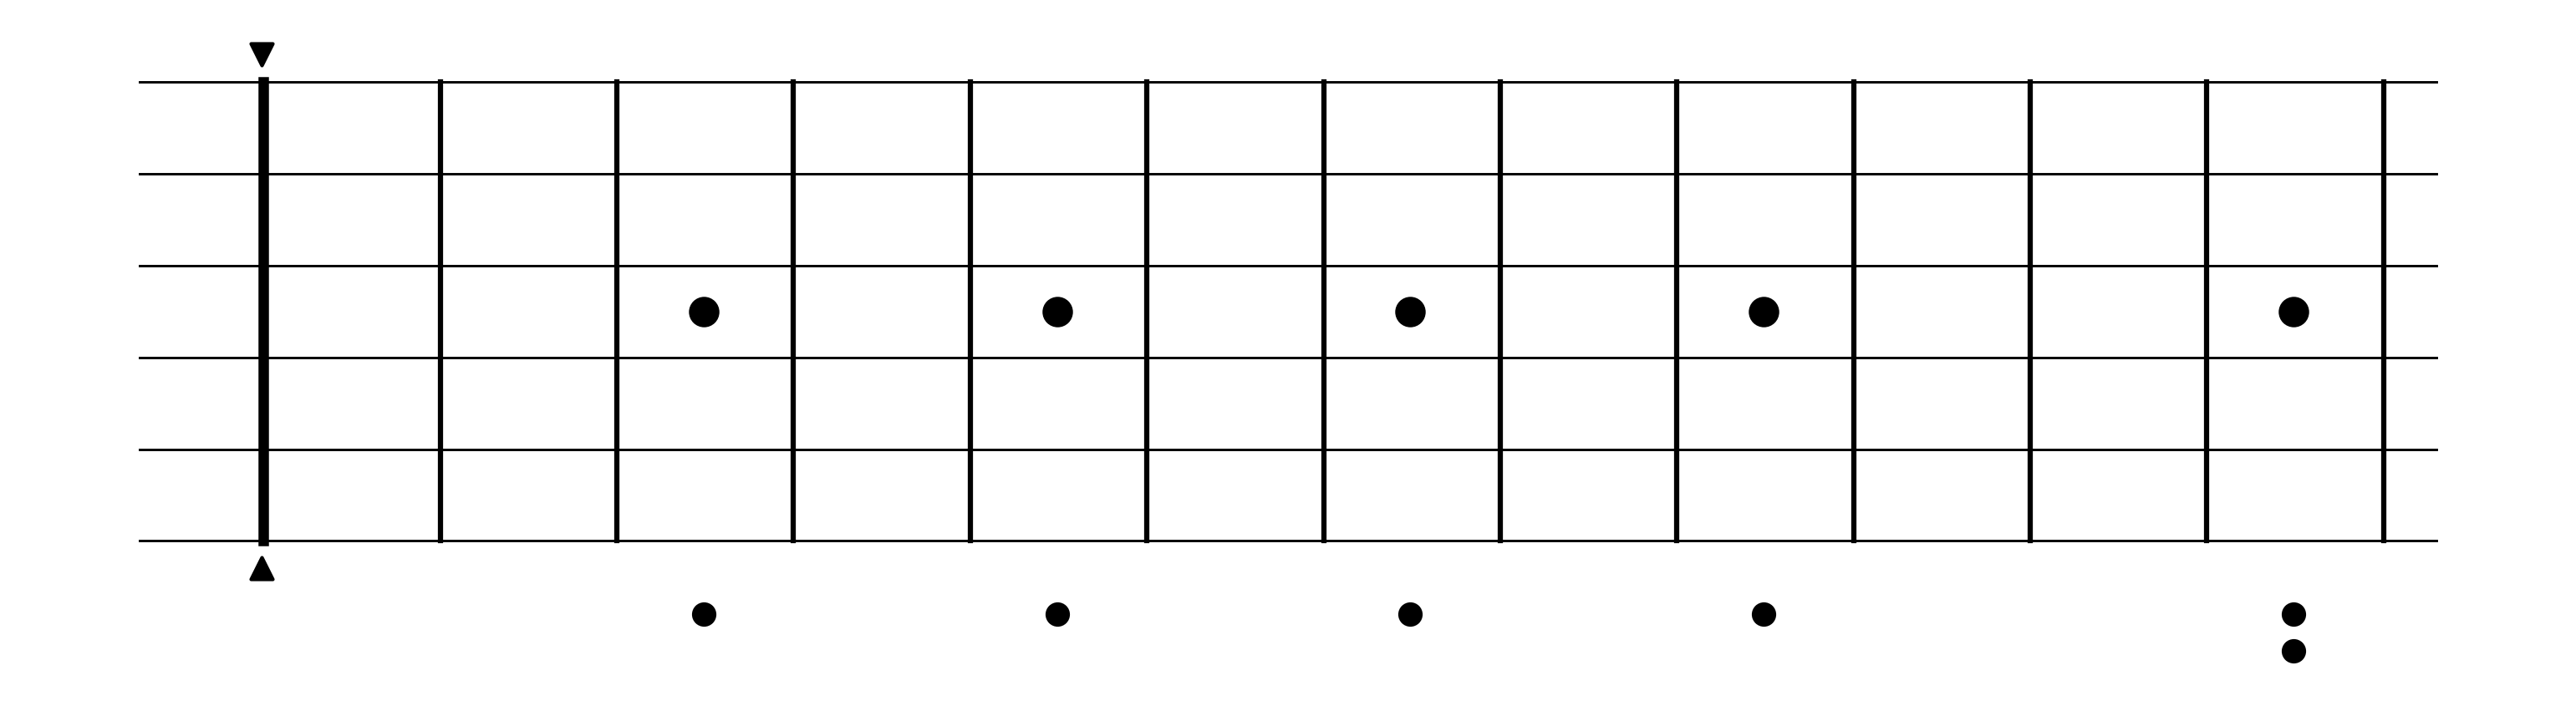
First, let’s draw an empty fretboard.
[3]:
from automuse.guitar import draw_scale

draw_scale([], capo=0, width=13)
Then, let’s draw a fretboard with all the notes. Sorry but I have ran out of transitional words.
[4]:
from automuse.guitar import draw_scale

draw_scale(list(automuse.NOTES), capo=0, width=15)
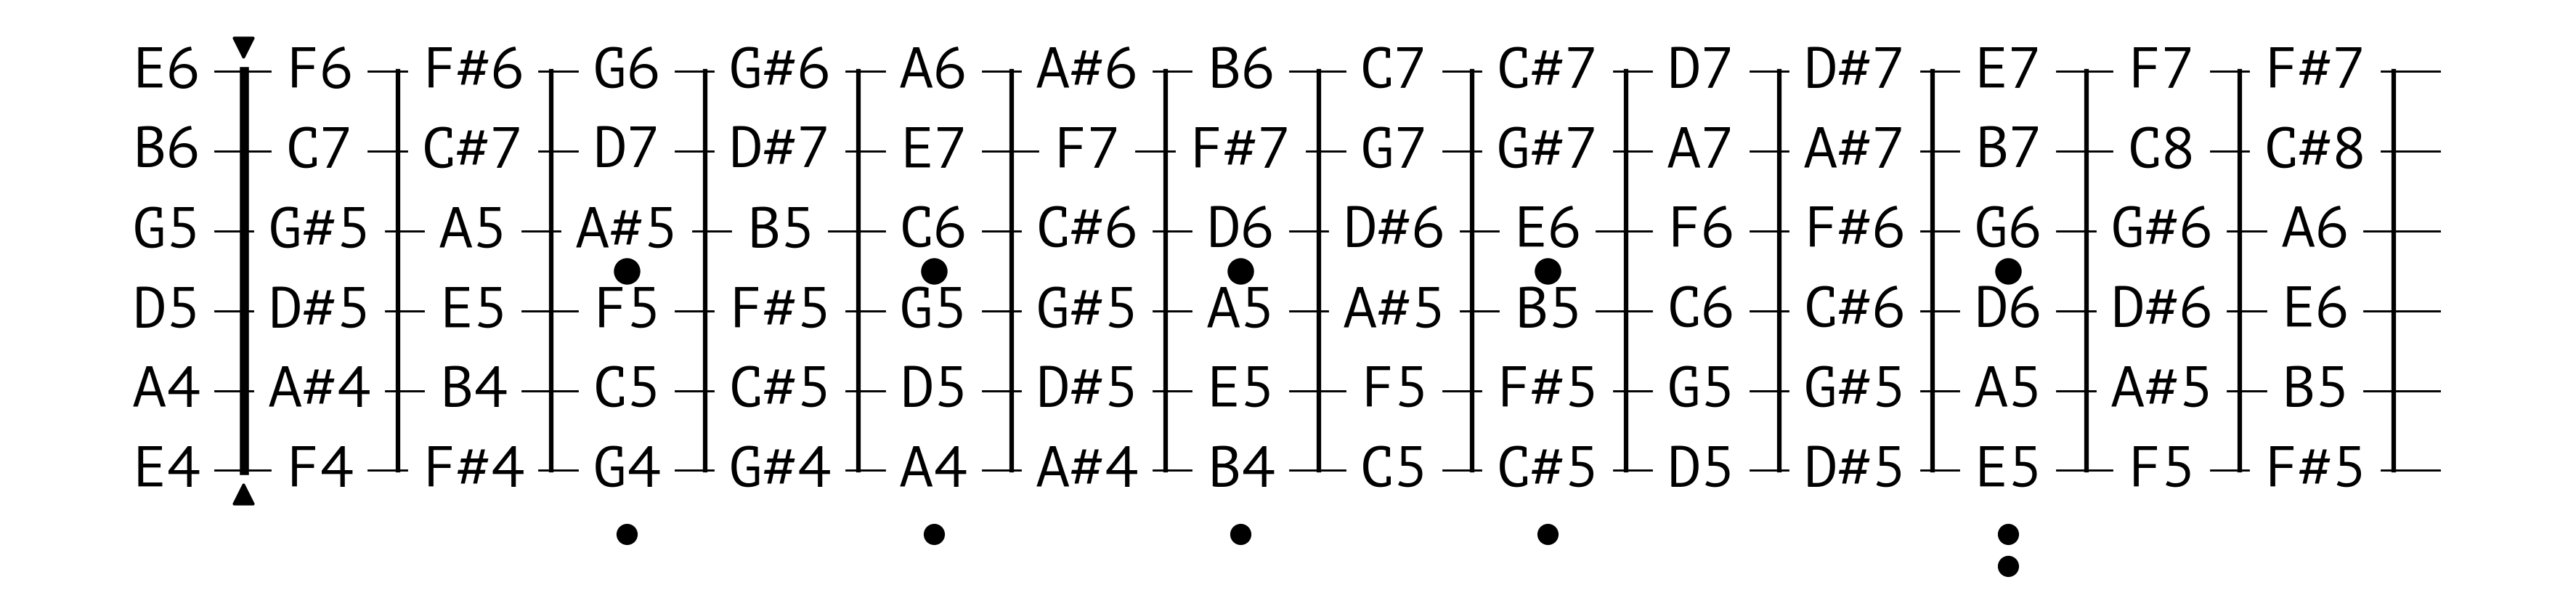
Let’s visualise some notes next. By default, the visualiser shows all notes in the same class – for example, drawing \(C_5\) draws \(C_4\) and \(C_6\) as well. You can change it with an option, but please bear with the tutorial for now.
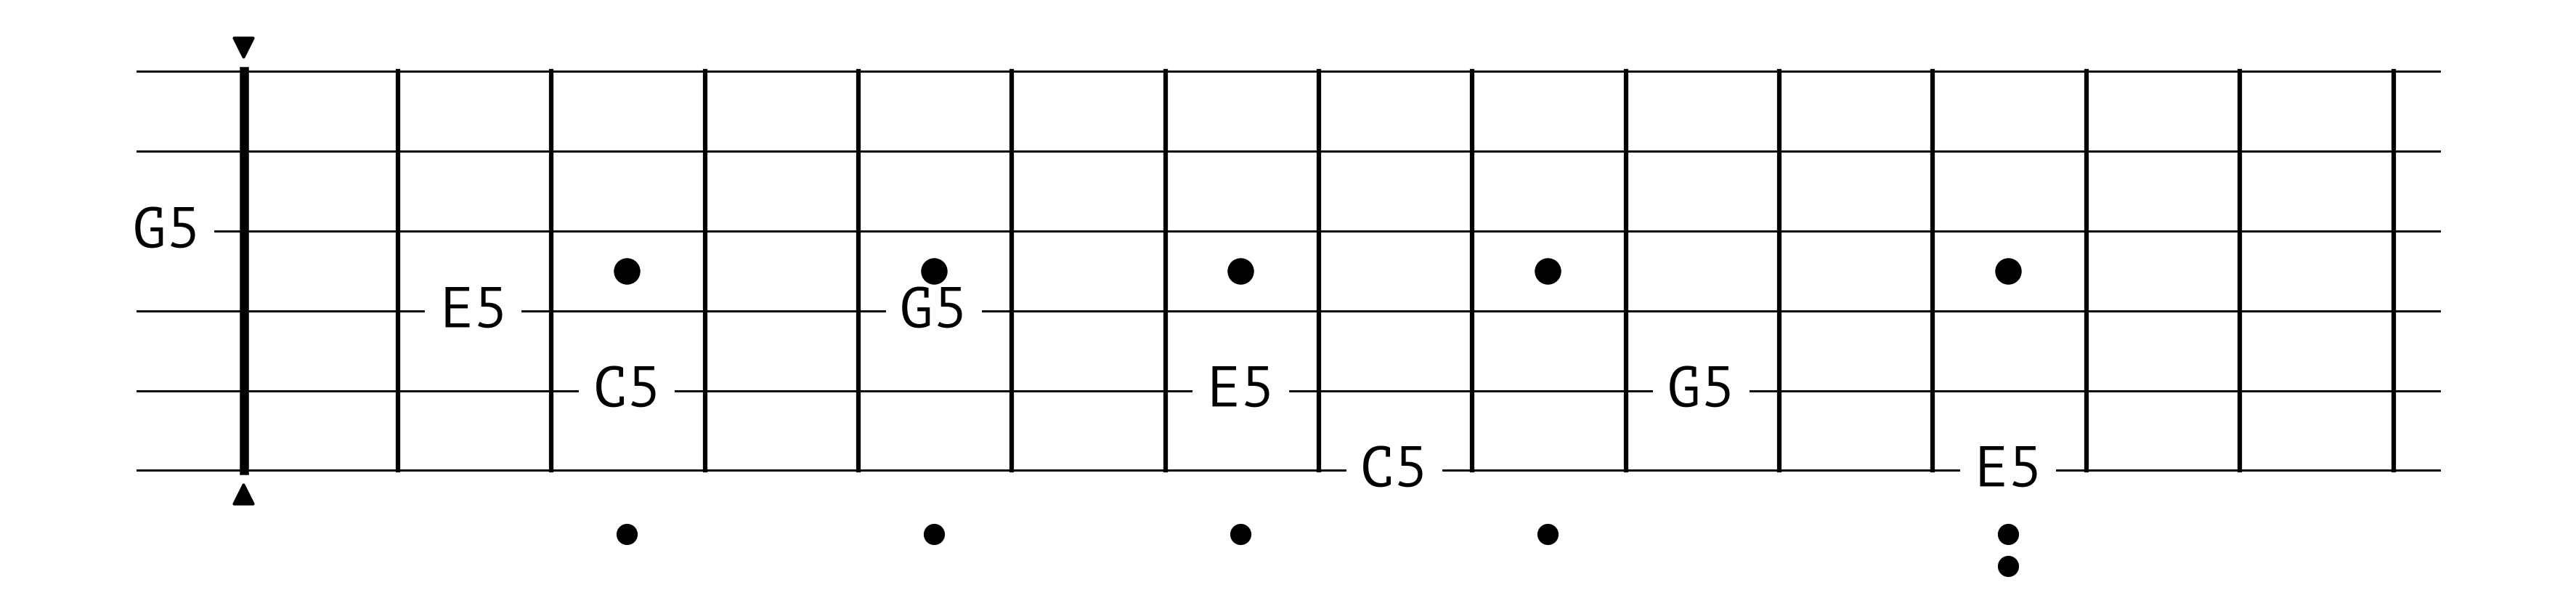
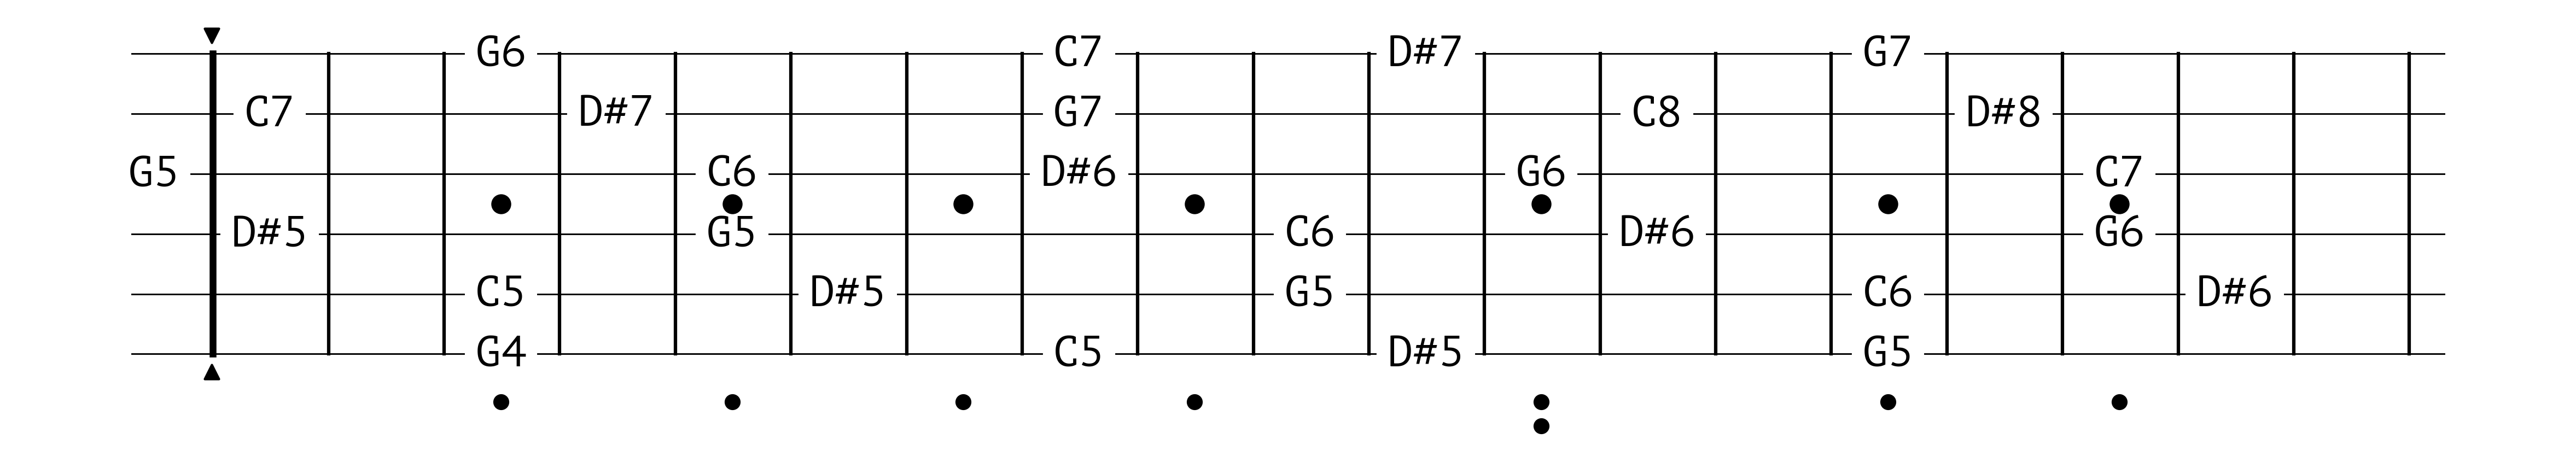
[5]:
draw_scale(chord.seventh("C5", modes.MINOR), 0, 20)
Try a blues triad next!
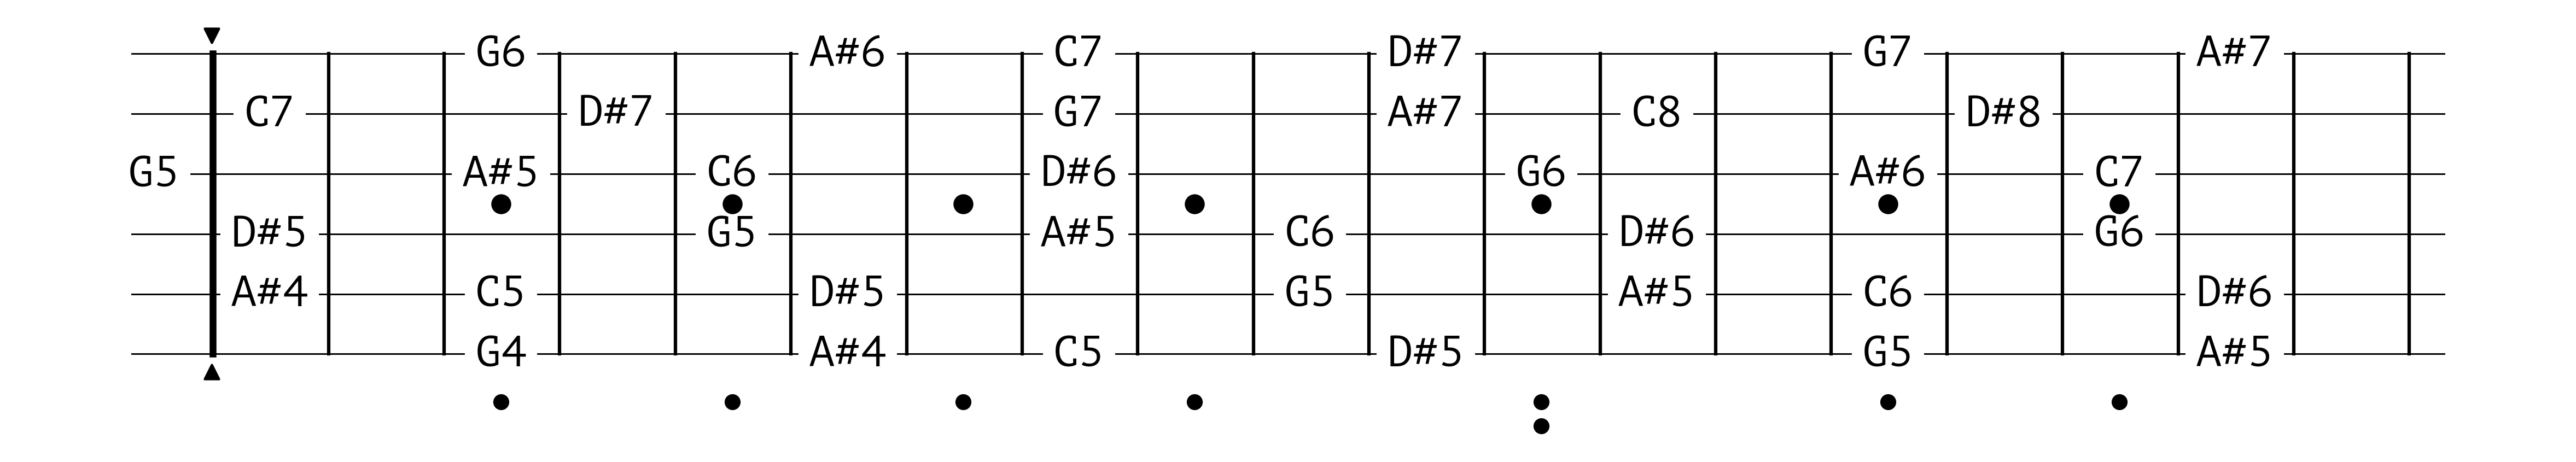
[6]:
draw_scale(chord.chord("C5", modes.MAJOR_BLUES), 0, 20)
Strict Mode
To only draw notes on specific octaves, use strict=True.
Up to the 12th fret, the guitar can play notes from E4 (52 in the MIDI standard) to E7 (88 in the MIDI standard), so let’s try the \(C_5\) major.
[7]:
draw_scale(chord.chord("C5", modes.MAJOR), 0, 15, strict=True)